Analytics Visualization - IC003
₹ 4,500/-About The Course
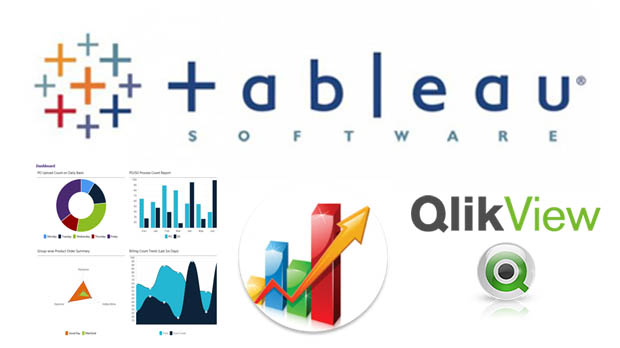
World is moving towards Big-data and Analytics
Tableau is currently the fastest running Visualization tool in market. It provides various options for presenting various charts and graphs along with excellent data compression.
Tableau has been leading the show for past couple of years according to Gartner's Quadrant Assessment!
| Quick Syllabyus | Projects |
|---|---|
|
>Installation, Basics
>Dataset and Connectivity >Reports & Dashboards >Charts - Pie, Donut, Bar, Stacked-bar, Line, Spider >Click and Hover Events |
>Sales Overview
>Y-O-Y Trend Dashboards >Finance, Business & Management Dashboards >Operational & Comparison Dashboards >Click and Hover Events |
More Courses

Amateur Android - IC001
₹ 1,500/- Per Month (Scholarship upto 90%)
>Installation & Basics
>Database & Framework
>HTML5, CSS3 & JQuery
>Forms, Events & JSON
>Pattern Recognition, Web Services, SQL Joins...
Amateur PHP - IC002
₹ 1,500/- Per Month (Scholarship upto 90%)
>Installation & Basics
>Database & Framework
>HTML5, CSS3 & JQuery
>Forms, Events & JSON
>Pattern Recognition, Web Services, SQL Joins...